
British Columbia Real Estate Market Analysis: 2019-2025
by Florencio Jr Mende
As your dedicated REALTOR in Victoria, BC, my role is to provide you with most up-to-date market information. Hence, I have provided my analysis on the following topics: Active and New Listings in BC, Sales by Region in BC, House Price Index and more!
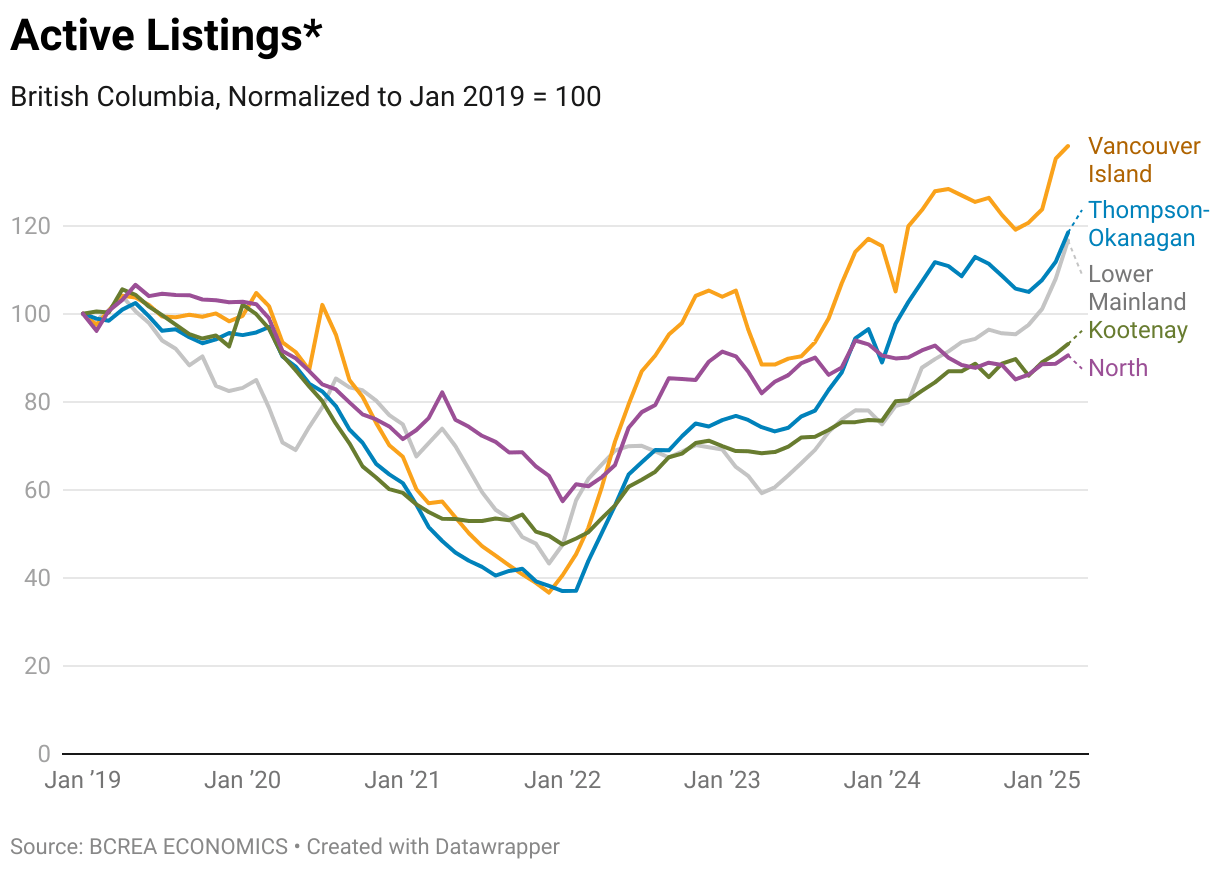
Active Listings in British Columbia
The graph illustrates the trends in active real estate listings across various regions in British Columbia from January 2019 to January 2025, normalized to a baseline of 100 in January 2019. Initially, all regions—Vancouver Island, Thompson-Okanagan, Lower Mainland, Kootenay, and North—start at the same level, but a significant divergence occurs over time. By early 2021, listings drop sharply across all regions, likely due to heightened demand and low inventory during the pandemic-driven housing boom, reaching a low of around 40. However, from mid-2022 onward, listings begin to recover unevenly: Vancouver Island and Thompson-Okanagan see the most dramatic increases, surpassing the 2019 baseline and peaking above 120 by 2025, indicating a robust market recovery or oversupply. In contrast, the Lower Mainland, Kootenay, and North regions show more modest growth, remaining below or near the 2019 level, suggesting slower market activity or sustained demand outpacing supply in these areas. This disparity highlights regional variations in housing market dynamics over the six-year period.
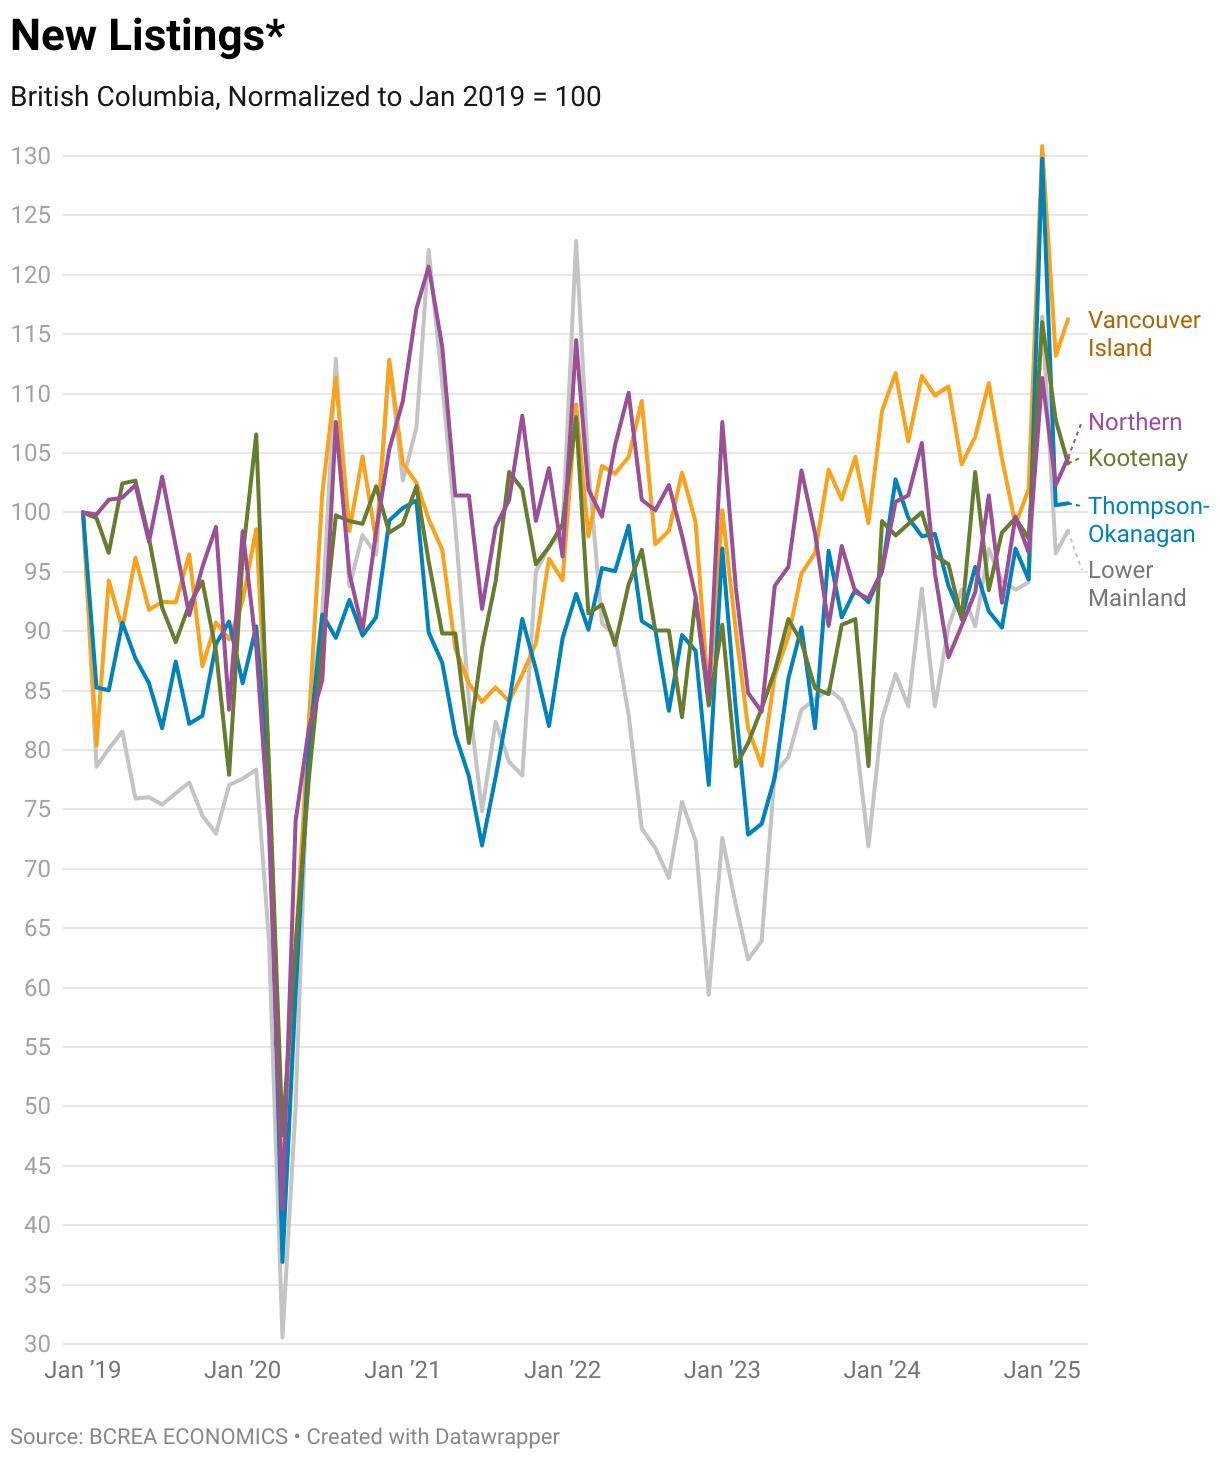
New Listings in British Columbia
The graph depicts the trends in new real estate listings across British Columbia regions from January 2019 to January 2025, normalized to a baseline of 100 in January 2019. Initially, all regions—Vancouver Island, Northern, Kootenay, Thompson-Okanagan, and Lower Mainland—show similar levels with some early volatility, peaking slightly above 110 in 2019. A sharp decline occurs in early 2020, dropping to around 35 by mid-2020, likely due to the COVID-19 pandemic's impact on market activity. From 2021 to 2023, new listings fluctuate between 60 and 110 across regions, indicating a recovery with seasonal variations. By 2024, most regions stabilize around 90 to 100, but a dramatic spike occurs in early 2025, particularly for Vancouver Island and Thompson-Okanagan, which surge to around 130, while other regions like Kootenay and the Lower Mainland remain closer to the baseline. This late surge suggests a sudden influx of new properties in certain markets, possibly driven by economic shifts or policy changes, highlighting regional disparities in market activity.
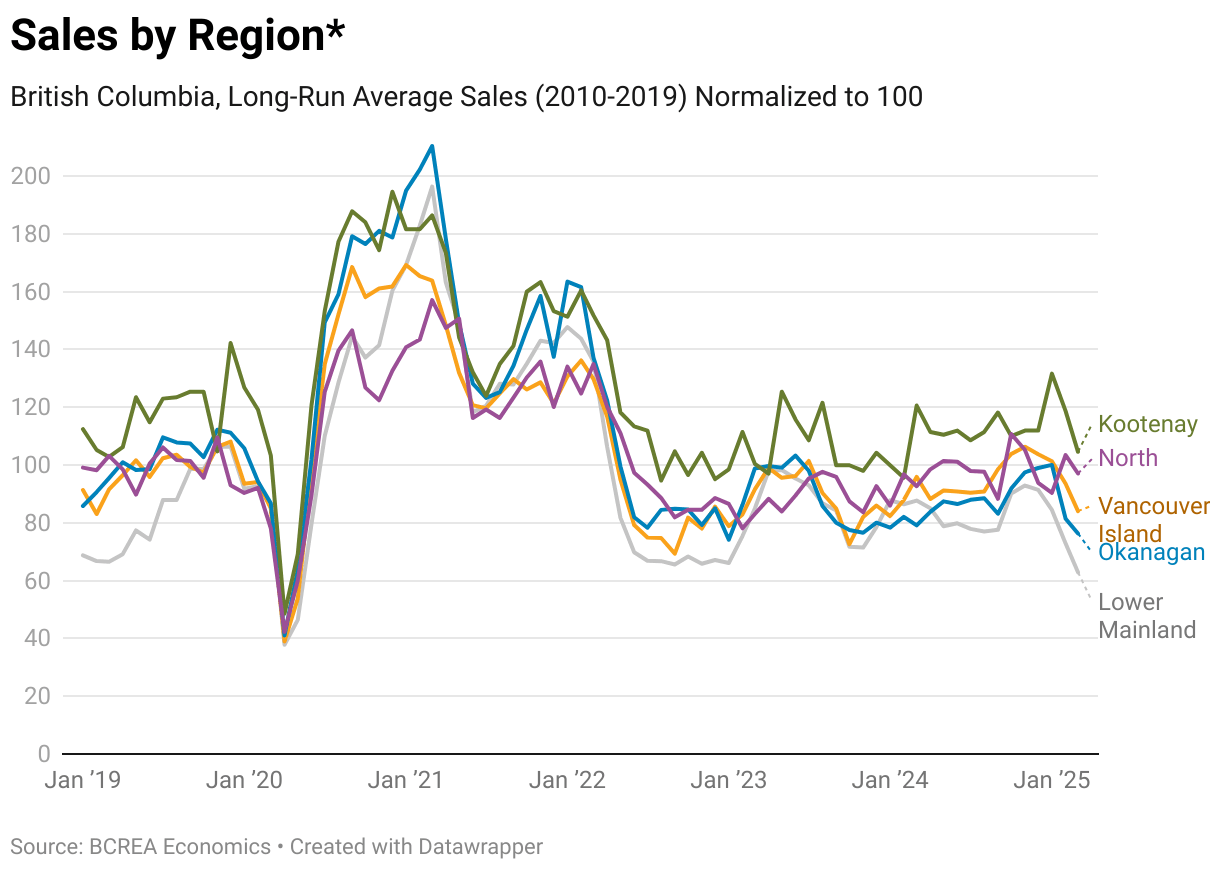
Sales by Region in British Columbia
The graph displays real estate sales trends by region in British Columbia from January 2019 to January 2025, normalized to the 2010-2019 long-run average of 100. Sales across all regions—Kootenay, North, Vancouver Island, Thompson-Okanagan, and Lower Mainland—start near the baseline in 2019 but plummet sharply by early 2020, dropping below 20, likely due to the onset of the COVID-19 pandemic. A dramatic rebound occurs by mid-2020, with sales peaking around 180-200 in early 2021, particularly in Kootenay and Thompson-Okanagan, reflecting a pandemic-driven housing boom fueled by low interest rates and increased demand. Sales then decline steadily through 2022, stabilizing around 80-100 from 2023 to mid-2024, indicating a return to more balanced market conditions. However, a sharp drop occurs in late 2024, with sales falling below 80 across all regions by January 2025, suggesting a potential market cooldown possibly due to rising interest rates, economic uncertainty, or seasonal factors, with Kootenay and North showing slightly higher resilience compared to others.
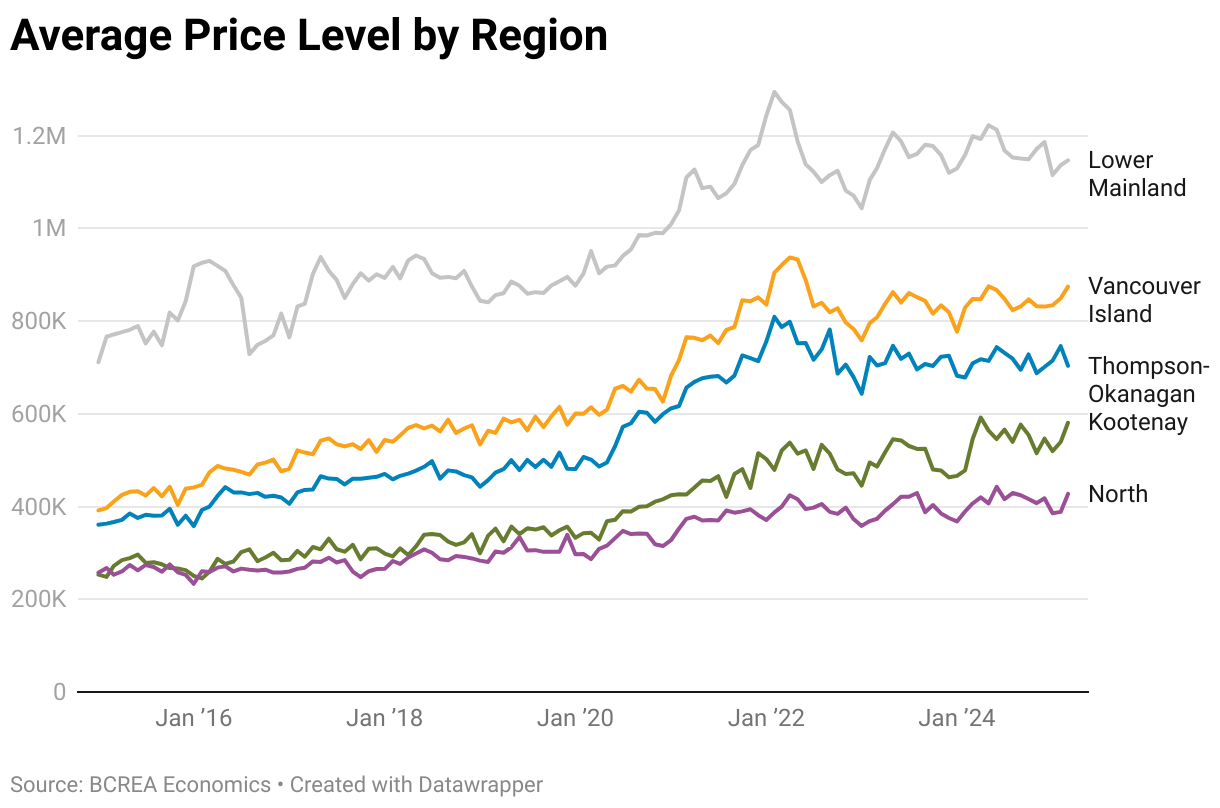
Average Price Level by Region in British Columbia
The graph illustrates the average real estate price levels by region in British Columbia from January 2016 to January 2025, showing distinct trends across the Lower Mainland, Vancouver Island, Thompson-Okanagan, Kootenay, and North. The Lower Mainland consistently exhibits the highest prices, starting around 800K in 2016, peaking near 1.2M in early 2022, and then slightly declining to around 1.1M by 2025, reflecting its status as a high-demand urban market with some correction after the pandemic peak. Vancouver Island and Thompson-Okanagan follow similar trajectories, starting around 400K, rising steadily to peak near 800K in 2022, and then stabilizing around 700K by 2025, indicating strong growth likely driven by lifestyle shifts and remote work trends during the pandemic. Kootenay and the North, starting below 300K, show more modest increases, reaching around 400K and 350K respectively by 2025, suggesting slower price growth in these less urbanized regions. Overall, the graph highlights significant regional disparities, with the Lower Mainland maintaining a substantial price premium, while all regions experience notable price increases over the nine-year period, particularly during 2020-2022.
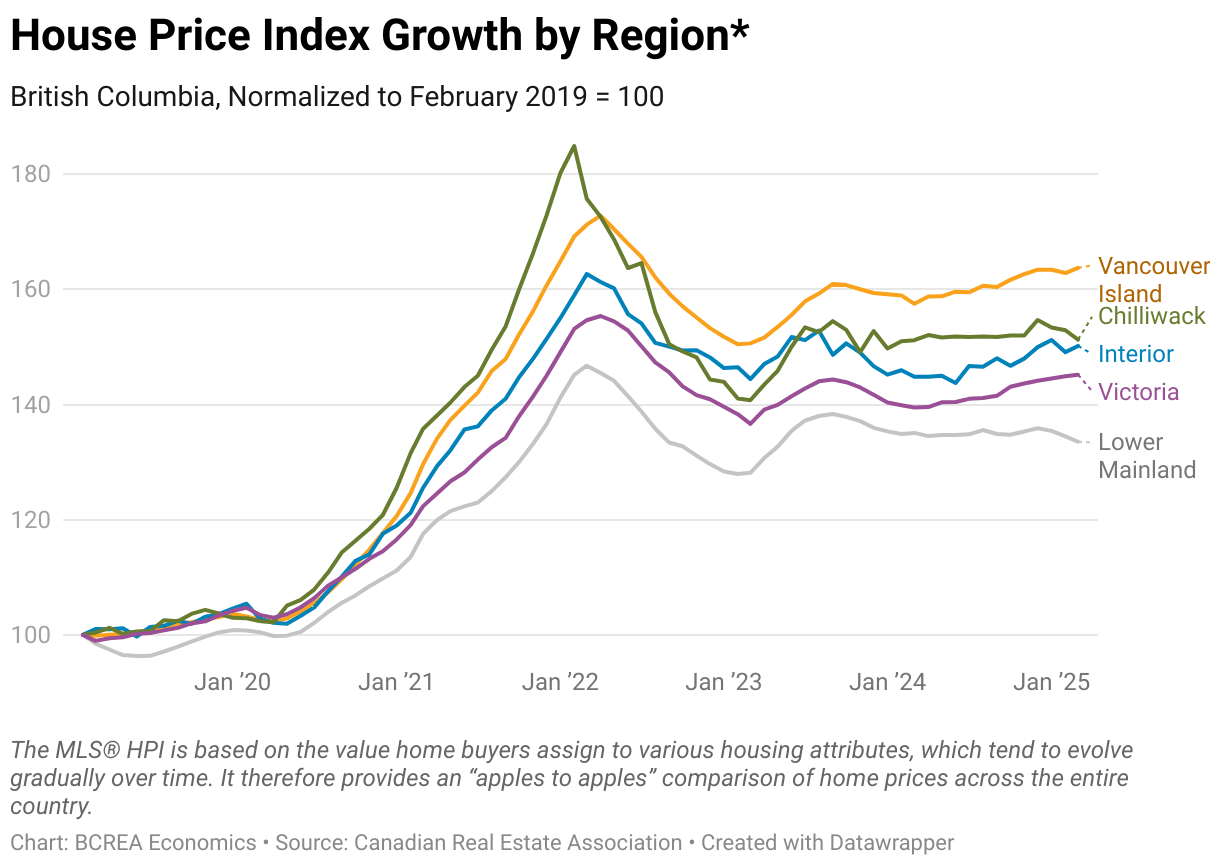
House Price Index Growth by Region in British Columbia
The graph illustrates the House Price Index (HPI) growth by region in British Columbia from February 2019 to January 2025, normalized to a baseline of 100 in February 2019. All regions—Vancouver Island, Chilliwack, Interior, Victoria, and Lower Mainland—start at the same level but experience significant growth, particularly between 2020 and 2022, with Chilliwack and Interior leading the surge, peaking around 180 by early 2022, likely driven by the pandemic housing boom, low interest rates, and increased demand for non-urban properties. Vancouver Island follows closely, reaching around 170, while Victoria and the Lower Mainland show more moderate growth, peaking near 150 and 140, respectively, reflecting their already higher baseline prices. After 2022, prices decline slightly across all regions, stabilizing between 130 and 160 by 2025, with Vancouver Island showing the strongest sustained growth at around 160, while the Lower Mainland remains the lowest at 130, possibly due to market corrections or affordability constraints in urban centers. This indicates a widespread price increase across BC, with rural and suburban areas experiencing more significant growth compared to urban markets.
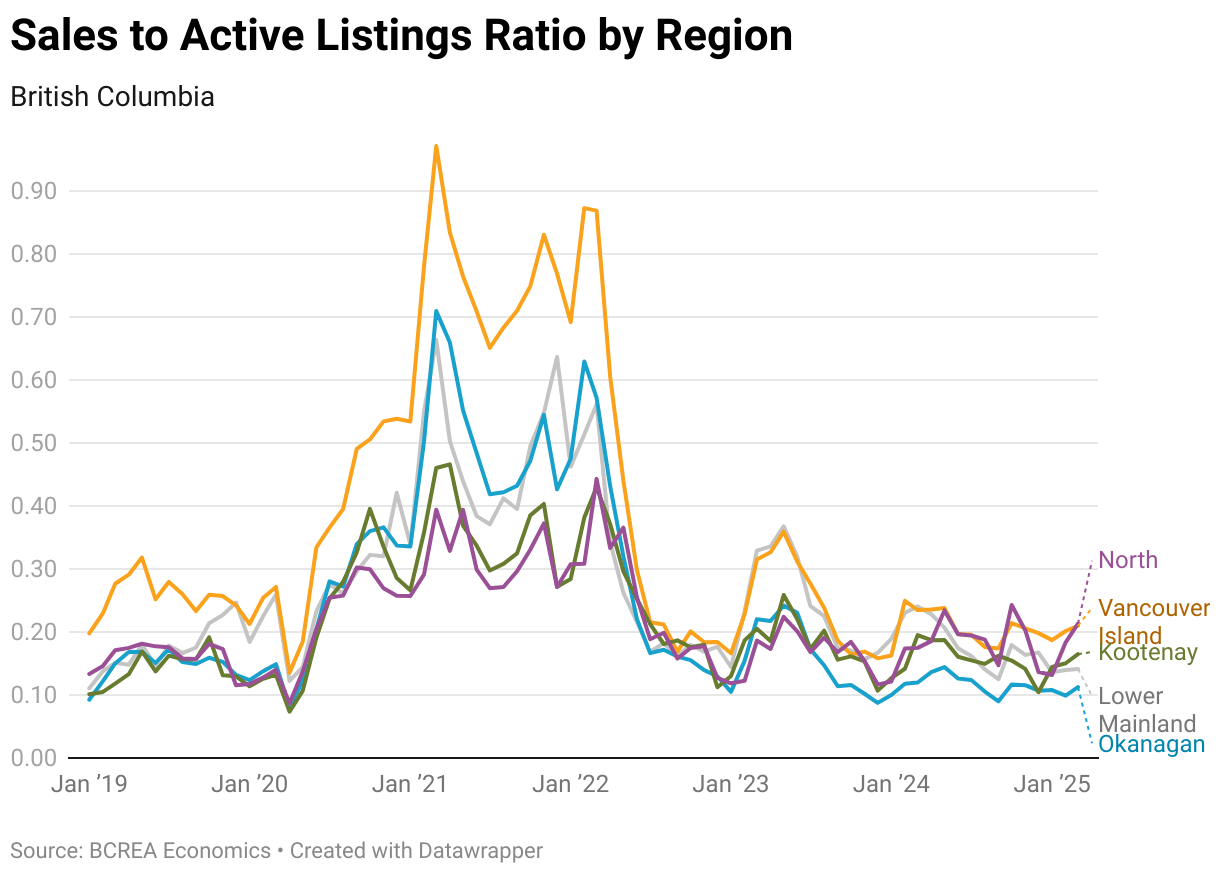
Sales to Active Listings Ratio by Region in British Columbia
The graph illustrates the sales to active listings ratio across British Columbia regions from January 2019 to January 2025, reflecting market tightness where a higher ratio indicates a seller’s market. Starting around 0.10-0.20 in 2019, the ratio surges dramatically by early 2021, with Vancouver Island and Thompson-Okanagan peaking near 0.90, and other regions like the Lower Mainland, Kootenay, and North reaching around 0.60-0.70, signaling an extremely tight market likely due to the pandemic-driven demand surge and low inventory. This peak corresponds with the sharp decline in active listings seen in prior graphs. By mid-2021, the ratio begins to decline as active listings recover, dropping to around 0.10-0.20 by early 2023 across all regions, indicating a shift to a more balanced or buyer-friendly market. From 2023 to 2025, the ratio fluctuates between 0.10 and 0.30, with Vancouver Island and Thompson-Okanagan showing slightly higher ratios, reflecting their higher active listings growth, while the Lower Mainland and North remain lower, aligning with their slower recovery in listings and sales. This trend underscores a significant market shift from a seller-dominated peak in 2021 to a more balanced state by 2025.
Categories
Recent Posts


CONTACT FLORENCIO BELOW TO GET MORE INFO: